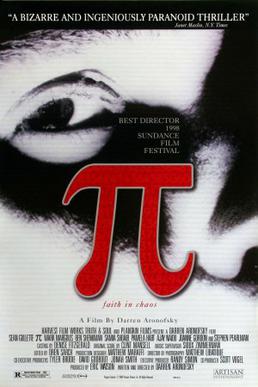

One of my favorite movies is Pi, written and directed by Darren Aronofsky. I love so many things about this film — from its film student film student thesis on steroids feel, to its late 1990s techno soundtrack — but its biggest effect on me was to seed my love of mathematics.
The protagonist, Max Cohen, is a mathematician, and his story arch is punctuated by a series of math troupes and stories brilliantly inserted in a dystopian thriller.
Max often restates his assumptions by giving the time of day then saying:
- Mathematics is the language of nature.
- Everything around us can be understood by numbers.
- If you graph the numbers of a system patterns emerge.
Twice a day, the NYC Health Department provides data on COVID-19. It’s interesting. We’ve learned that the largest age group that has the virus is between the ages of 18 to 44. (43% of all cases.) The virus seems to like men more than women — 56% of cases are in males. In terms of NYC boroughs, Queens has the most cases at 32%.
I also noticed the overall number of confirmed cases in NYC over the last few weeks:
3/18 : 2k
3/19 : 5k
3/21 : 8k
3/23 : 13k
3/25 : >21k
3/29: >34K
The numbers aren’t a perfect representation, but these are Fibonacci numbers. The Fibonacci sequence is where you take the last two numbers in a sequence and add them to produce the next element in the sequence. The start of the Fibonacci numbers are ; 1, 1, 2, 3, 5, 8, 13, 21, 34, 55, 89, 144…
Looking at the Fibonacci numbers as a way to understand the growth of the virus in NYC might be a crude yet effective model. First, we see the Fibonacci numbers coming up in the data one after another, then we see the following Fibonacci numbers appearing with a day or two between. That might point to social distancing working in slowing the rate of infection. At the same time, numbers are still going up at predictable levels. It is entirely possible we will see the 55K of New Yorkers having Covid-19 by the end of the week.
As any mathematician will tell you, these numbers are everywhere in nature. For example, the amount of seeds in a fruit — a banana has 3 sections and an apple, 5 seeds, and flower petals come in “3, 5, 8” variations. The number of sunflower seeds that can be packed into one sunflower works the same way. This often happens to optimize the amount of sunlight exposure or maximize the amount of seeds that can be held. You can check this if you are bored in line at Whole Foods.
If you start to divide the larger Fibonacci number with the smaller number, you will start to get a number that approaches Phi, or 1.61803, which is also known as the Golden Ratio.
Phi is used to describe growth in nature. If you started to draw boxes with the Fibonacci numbers on graph paper, you would create the Golden Rectangle. Your flatscreen TV or IMAX screen has this ratio. If you draw a curve around all these boxes that you drew on your graph paper, you get a spiral. That spiral is seen across nature from the shapes on pineapples and snail shells, to the spiral of galaxies in the universe. Aronofsky did a good job of showing the spiral in cream being added to coffee and smoke being blown from a cigarette in his movie, Pi.
If you represented the number COVID-19 infections per country in boxes, you will start to see a similar looking rectangle with a similar spiral. An obvious criticism would be that the numbers don’t fit exactly, or that the numbers that resemble the Fibonacci sequences aren’t contiguous.
My response would be that the data is imperfect. There are bottlenecks occurring as far as how many tests are available, how many people can be safely tested, and how fast the labs can process tests. According to Governor Cuomo, no place in the world is testing more people per capita than New York State.
Finally, let’s not forget that not everyone is being tested — only those with symptoms severe enough to warrant a test are being tested. (Or if you are rich enough to pay for a private test, like some NBA teams.)
Looking at the COVID-19 numbers in terms of Fibonacci sequence might seem like a collegiate thing to do. Hell, you might have even first heard about Fibonacci in high school. However, these numbers keep coming up in unexpected places.
Music is another Fibonacci experience. You can see Phi or 1.61803 in classical music from Mozart to Debussy. There exists what is known as a Phi moment in music. This happens when the notes start to take the shape of the Fibonacci numbers. You get to this moment by dividing the length of a piece of music by 0.618. Two famous examples are Drake’s “In My Feelings” when he starts singing about Bernadette, or Queen and Bowie’s “Under Pressure” at 152 seconds into the song.
I debated whether to write another piece about COVID-19. Despite the fact that my last two pieces were on the subject, lots of the world is under some sort of self-isolation, and they are all producing loads of content. However the Brooklyn College newspaper should document the student experience during this time. It reminds of the Sylvia Path poem, “Tulips”: “ …like an eye between the two lids that will not shut. Stupid pupil, it has to take everything in…”
